 |
 |
Quick Links
-
Installation
-
Usage
-
Getting help
Containers
-
Geronimo
-
GlassFish
-
JBoss
-
Jo!
-
JRun
-
Payara
-
Resin
-
WebLogic
-
WebSphere
-
WildFly
Independent extensions
Development
|
||
DefinitionExplain how to perform debugging when something doesn't work in CargoSometimes, it can happen that the container does not start or stop as expected or you might have reasons to believe that Codehaus Cargo is "acting weird". Here is a short list of things you can do to try debugging the problem. Embedded containers Remember that Codehaus Cargo supports different types of containers, and particularly pay attention that embedded containers will be ignoring the JVM arguments you provide: as they are embedded, they will by definition simply take over whatever is coming from the host JVM. In other words, when using an embedded container in your own application, Ant tasks or the Maven 3 Plugin, you actually will have to put your application, Ant or Maven itself in a debug mode to debug the actual container. The best solution is to use an installed container instead, which also provides a much more realistic execution environment.
Debugging the containerMost Java Virtual Machine implementations support remote debugging. Once started in debug mode, you can then remotely connect to your container using any IDE and debug your container and/or application. In order to do so, add the following arguments to the JVM start arguments configuration property: -Xdebug -Xrunjdwp:transport=dt_socket,server=y,suspend=<suspend>,address=<port> -Xnoagent -Djava.compiler=NONE where:
Here is an example for starting a JOnAS 5.x container in Remote Debug on port 8000 without suspend mode using the Maven 3 plugin: <plugin>
<groupId>org.codehaus.cargo</groupId>
<artifactId>cargo-maven3-plugin</artifactId>
<version>${cargo.version}</version>
<configuration>
<container>
<containerId>jonas5x</containerId>
<type>installed</type>
<home>${jonas.root}</home>
</container>
<configuration>
<type>existing</type>
<home>${jonas.base}</home>
<properties>
<cargo.servlet.port>${http.port}</cargo.servlet.port>
<cargo.start.jvmargs>
-Xdebug
-Xrunjdwp:transport=dt_socket,server=y,suspend=n,address=8000
-Xnoagent
-Djava.compiler=NONE
</cargo.start.jvmargs>
</properties>
</configuration>
</configuration>
</plugin>
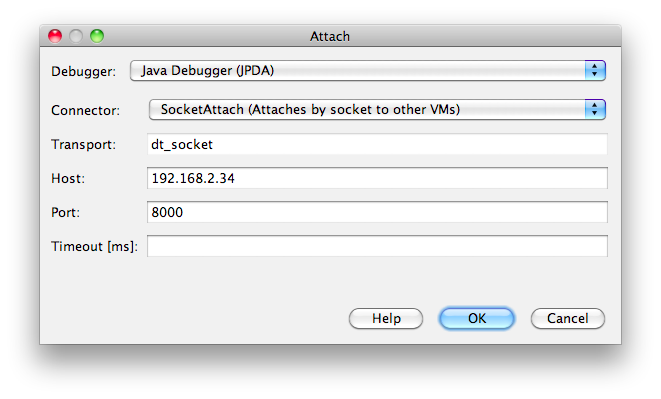
Once the server is started, follow these steps to remotely debug your server and/or application:
Steps for achieving the same in Eclipse IDE are similar. About the cargo.start.jvmargs property The JVM start arguments configuration property only exists since Codehaus Cargo 1.4.18. With older versions, you'll have to use [INFO] [talledLocalContainer] FATAL ERROR in native method: JDWP No transports initialized, jvmtiError=AGENT_ERROR_TRANSPORT_INIT(197) [WARNING] [talledLocalContainer] ERROR: transport error 202: bind failed: Address already in use [WARNING] [talledLocalContainer] ERROR: JDWP Transport dt_socket failed to initialize, TRANSPORT_INIT(510) [WARNING] [talledLocalContainer] JDWP exit error AGENT_ERROR_TRANSPORT_INIT(197): No transports initialized [../../../src/share/back/debugInit.c:741] Redirecting container output to a file and setting the log level of the containerExample using the Java APIThe Cargo is able to configure containers to generate various levels logs. There are 3 levels defined in configuration.setProperty(GeneralPropertySet.LOGGING, LoggingLevel.HIGH.getLevel()); The generated log files will then be found in the working directory you have specified on the container (through the Starting Tomcat 8.x specifying an output console log file: LocalContainer container = new Tomcat8xLocalContainer(
new CatalinaStandaloneLocalConfiguration("target/tomcat8x"));
container.setHome("c:/apps/apache-tomcat-8.5.85");
container.setOutput("target/output.log");
container.start();
Use the Example using the Ant APIStarting Tomcat 8.x specifying an output console log file with the highest possible level of logs: <cargo containerId="tomcat8x" home="c:/apps/apache-tomcat-8.5.85"
action="start"
output="target/output.log"
append="false">
<configuration home="target/tomcat-home">
<property name="cargo.logging" value="high"/>
</configuration>
</cargo>
Use the Example using the Maven 3 pluginStarting Tomcat 8.x specifying an output console log file with the highest possible level of logs: <container>
<containerId>tomcat8x</containerId>
<home>c:/apps/apache-tomcat-8.5.85</home>
<output>target/output.log</output>
<append>false</append>
</container>
<configuration>
<properties>
<cargo.logging>high</cargo.logging>
</properties>
</configuration>
Use the Debugging Codehaus Cargo itselfTo enable the Java debugger on ANT, export the export ANT_OPTS="-Xdebug -Xrunjdwp:transport=dt_socket,server=y,suspend=y,address=8000" On Maven 3, enabling Java debugger is done using the mvnDebug command on MacOS X Note that on MacOS X, Redirecting Codehaus Cargo logs to a fileExample using the Java APISome Cargo classes support generation of logs. This is implemented through the notion of For example to turn on logging monitoring on a Logger fileLogger = new FileLogger(new File("c:/tmp/cargo.log"), true);
fileLogger.setLevel(LogLevel.DEBUG);
container.setLogger(fileLogger);
There are several Loggers that are readily available in the Cargo distribution:
Example using the Ant APIWhen using the Ant tasks, Codehaus Cargo will by default use the AntLogger. You can specify the log level using the <cargo containerId="tomcat8x" home="c:/apps/apache-tomcat-8.5.85"
action="start"
logLevel="debug"
log="target/cargo.log"/>
Example using the Maven 3 pluginWhen using the Maven 3 plugin, Codehaus Cargo will by default use the MavenLogger. When you use If you want to use the plugin in debug mode without having Maven itself in debug mode, you can specify the log level using the <container> <containerId>tomcat8x</containerId> <home>c:/apps/apache-tomcat-8.5.85</home> <log>target/cargo.log</log> <logLevel>debug</logLevel> </container> Debugging your application(s) on the containerThe hints above to start the container in debug mode would obviously also allow you to debug your application(s) running on that container. Nevertheless, what you might experience is that your application's log levels do not follow what you defined as container log level. Sadly, there is little Codehaus Cargo can do in this case: you will have to look into your application's distribution, and find existing logger definitions, to update them. |
| Copyright 2004-2026. All rights reserved unless otherwise noted.
|
Click here to read our privacy and cookie policy |
